Responding to Issues
November 25, 2014
This morning I got an email from New Relic informing me that the CPU load on Emberall’s staging server had been over 80% for over 5 minutes. It’s not unusual for the CPU to peg pretty high during video reencoding, and even to hit 100% for a limited time when a user has uploaded a lot of videos at once and they’re all being processed. But this was on the staging server, which only I use, and I hadn’t done any uploads this morning.
After checking that the server was still responding to requests, I logged into New Relic to see if I could quickly get any insight into the issue.
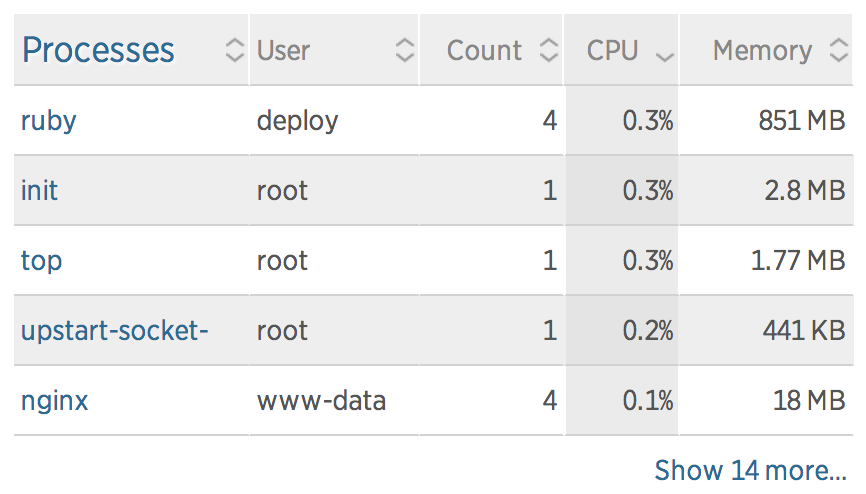
Interestingly, no process appeared in New Relic’s server report as using an unreasonable amount of CPU — or even much at all. The levels all appeared to be about where I would expect an idling system to sit, which seemed to contradict the big graph showing the CPU usage pegged to 100%.
To get a better look into what was going on I SSH’d into the box itself and ran top.
provision@kapshare-stage:~$ sudo top
top - 10:56:52 up 6 days,  8:05,  1 user,  load average: 1.22, 1.22, 1.18
Tasks: 250 total,   3 running, 247 sleeping,   0 stopped,   0 zombie
%Cpu(s): 87.4 us, 12.3 sy,  0.0 ni,  0.0 id,  0.3 wa,  0.0 hi,  0.0 si,  0.0 st
KiB Mem:   1718596 total,  1528504 used,   190092 free,    44444 buffers
KiB Swap:        0 total,        0 used,        0 free.   307752 cached Mem

  PID USER      PR  NI    VIRT    RES    SHR S %CPU %MEM     TIME+ COMMAND
22988 deploy    20   0   63396  15952   3312 R  7.6  0.9   0:00.23 ruby
    1 root      20   0   33740   2892   1324 S  0.7  0.2   0:44.55 init
    8 root      20   0       0      0      0 S  0.7  0.0   1:39.38 rcuos/0
    7 root      20   0       0      0      0 R  0.3  0.0   0:52.99 rcu_sched
 1121 message+  20   0   39224   1312    872 S  0.3  0.1   0:07.24 dbus-daemon
14896 root      20   0   19476    448    248 S  0.3  0.0   0:06.21 upstart-udev-br
17382 provisi+  20   0  105632   1860    872 S  0.3  0.1   0:00.21 sshd
17572 root      20   0   23840   1808   1116 R  0.3  0.1   0:00.41 top
    2 root      20   0       0      0      0 S  0.0  0.0   0:00.00 kthreadd
This did show a ruby process using 7.6% CPU, but that isn’t particularly uncommon even when the system is idling. However, what was uncommon was that every time top refreshed, the ruby process’s PID jumped. Like, by 50.
I had a pretty good idea of what was going on at this point, so I checked the application’s logs to see if I was right.
provision@kapshare-stage:~$ tail -f /srv/www/legacy-video/current/log/*.log
[...]/http_server.rb:206:in `pid=': Already running on PID:10078
[...]/http_server.rb:206:in `pid=': Already running on PID:10078
[...]/http_server.rb:206:in `pid=': Already running on PID:10078
  ...
Yep. Turns out that Upstart, which we use for now to initialize Unicorn as well as all of our other server processes, had somehow lost track of Unicorn’s PID, assumed it shut down, and was faithfully trying to bring it back online. Of course, Unicorn couldn’t take ownership of the socket file because the old process was still running, and so it promptly shut itself down again. This loop repeated endlessly until I manually killed the old Unicorn process and allowed Upstart to successfully launch a new one.

Lessons learned
- Performance monitoring with appropriate alert conditions is an absolute necessity for a publicly-facing application. It’s impossible to predict and code for every possible error condition, and the next-best thing is to know the moment you enter one (and hopefully fix it before your customers notice).
- Big failures are sometimes better than little failures. In this case, the “big failure” (pegging the CPU at 100% ad infinitum) caused an alert to be triggered that lead to detecting the “little failure” (rogue Unicorn process). It is possible to configure Upstart to stop attempting to retry after a certain number of failures. However, if that feature had been activated we probably wouldn’t have discovered the error until the next deploy failed to produce any visible changes, which would probably have been harder to diagnose.
- Response time to errors is critical. As the CPU usage graph shows, this problem was ongoing for over an hour before I was able to resolve it. We’ve configured New Relic to issue alerts through email and Slack, but I was offline when the alerts came through and didn’t realize anything was going on until the problem had already been around for quite a while. As a result of this “dry run” I am investigating more proactive alerting solutions like Pager Duty.